The Analytics Feature in the dashboard provides advanced capabilities to monitor anomalies in real time, ensuring that users can promptly identify and respond to abnormal behaviors in their systems. This feature offers an intuitive and interactive interface that displays comprehensive anomaly insights, empowering users to make data-driven decisions
Below table show the description of Analytics dashboard configurable items
| Configurable Items | Description | |
|---|---|---|
| Attribute |
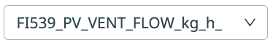
Attribute selection
|
Allows users to select specific attribute to visualize in the time-series chart. Users can pick individual attribute (e.g., FI539_PV_VENT_FLOW_kg_h_) instead of displaying all attributes, which helps in focusing on patterns within specific data. |

Show top
|
The "Show Top" option lets users visualize the most significant attributes based on anomaly contribution or relevance. Clicking Apply updates the visualization to reflect the attributes. | |
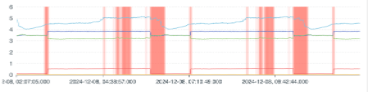
Data chart
|
Visualize the trend of selected attributes over time Hover over the graph to see data points for specific timestamps, enabling precise examination of patterns and potential anomalies. Highlighted sections in red indicate areas where anomalies have been detected, providing visual cues for further inspection. |
|
| Anomaly Score |

Gradient fill
|
Adds a gradient overlay to the anomaly chart, visually emphasizing the severity of anomalies. |

Table view
|
Enables users to display to a tabular format for anomaly data, providing detailed numerical values for each timestamp. | |
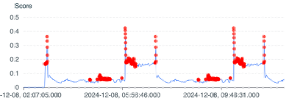
Anomaly Chart
|
Displays anomaly points and their corresponding scores in a chart for easy identification
Clicking on an anomaly point provides additional details, such as the contributing attributes or root causes for the anomaly. |
|
| AI Assistant |

Send message
|
Offers automated insights and recommendations based on detected anomalies. Clicking on a specific anomaly point and then clicking the Play button activates the AI Assistant |